Energy
We support access to affordable and clean energy, and we work to advance renewable energy opportunities, optimize energy consumption and minimize energy intensities. We believe renewable energy is one of many promising pathways to achieve our carbon intensity goal.
SDG #7, Affordable and Clean Energy
Our company purchases energy in the form of fuel, electricity and steam. Additionally, our manufacturing facilities leverage fuels created as a by-product during operations to generate energy on site. Supporting carbon intensity reductions and improving other air emissions performance is made possible by long-standing programs at CPChem focused on reliability and energy management.
In 2023, CPChem’s equity global energy consumption equaled 211 million MMBtu, and energy intensity totaled 5,378 Btu/lb. of product on an operated basis in 2023. CPChem’s total energy consumption increased in 2023, in part due to increases in both fuel consumption and production figures. CPChem’s manufacturing teams continuously seek out opportunities to increase efficiency across our facilities and boost energy performance. Showing impressive resolve, employees brought forth ideas and enhancements that helped CPChem decrease its energy intensity by 3% compared to the prior year.
Energy Consumption*
** Energy intensity is reported on an operated basis and represents 100% stake for wholly owned operations, with the exception of Performance Pipe.
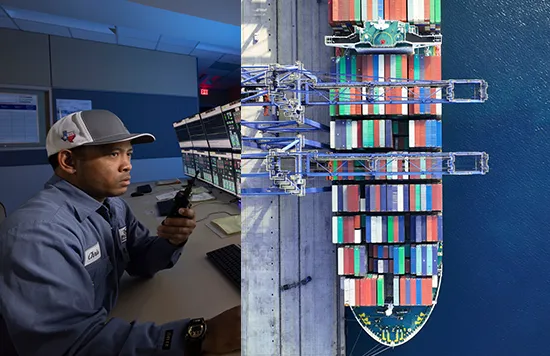
Energy Best Practice Teams
CPChem empowers local Energy Best Practice Teams to improve energy performance and initiate energy reduction projects. Team leaders routinely meet to share best practices, celebrate success, and challenge each other to creatively meet company energy goals. We experienced strong improvements in energy efficiency in 2023, receiving two awards from the American Chemistry Council for energy performance at our U.S. sites.
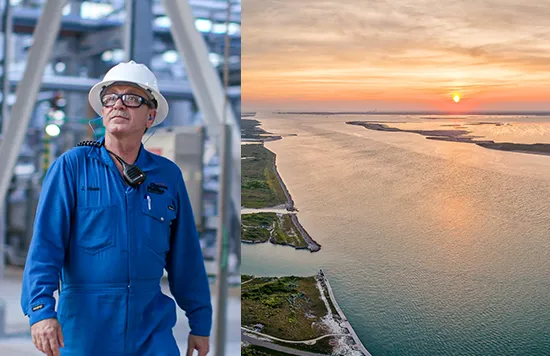
Saving Significant Energy
Polyethylene assets at CPChem's Old Ocean facility, reduced energy consumption per pound of product by 9.4% compared to 2022, 17% below a three-year average. These savings represent a reduction of 677,000 MMBtu and 35,000 MT of CO2e compared to 2022. Energy reductions were achieved by optimizing steam and fuel consumption in equipment and operations.
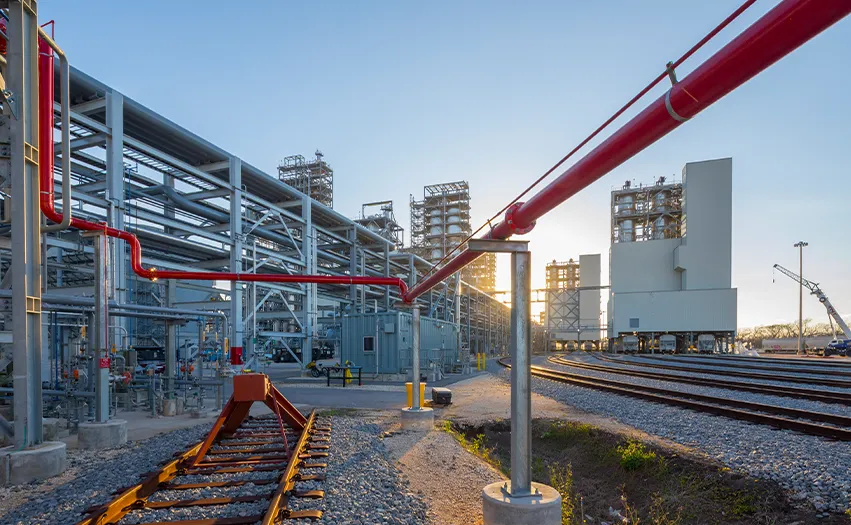
Installing Results
In 2023, CPChem's Orange facility continued to improve its energy performance through the installation of variable frequency drives (VFDs) on cooling towers, reducing electricity needs. The site also revamped its steam trap maintenance program and implemented a system to optimize repairs using a web-based tool. As a result, energy intensity at the site decreased 3.1% per pound of product.
Local Energy Best Practice Teams use a facility-level energy intensity index calculation to standardize benchmarking and monitoring efforts while tracking annual progress toward energy reduction goals. Along with running efficiently, unit outages, reliability, and capacity utilization continue to be factors in energy performance. CPChem recorded energy intensity indexes of its three main regions where CPChem operates facilities as 0.80 (Europe), 0.94 (Singapore) and 0.97 (United States).
Explore our Performance Data to learn more about energy performance at CPChem.
Energy Index and Energy Intensity by Region
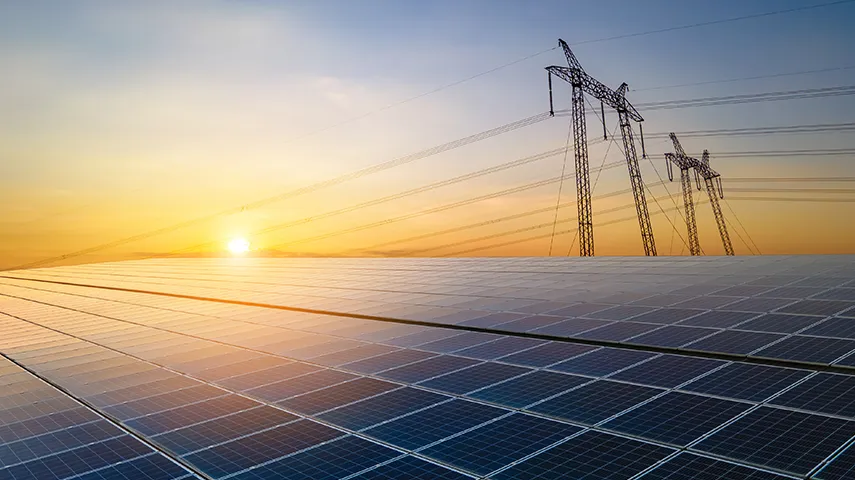
Renewable Energy
CPChem sees exceptional potential in renewable energy as a significant contributor to achieving the company’s carbon intensity goal. We have made strategic investments to accelerate growth in this industry, and we will look to sources of renewable energy for an increasing portion of our energy use on our path to 2030 and beyond.