Greenhouse Gas Emissions*
Scope 1
In 2025, CPChem’s Scope 1 emissions on an operated basis were 4.5 million metric tons (MMT) CO2e, and 7.1 MMT CO2e on an equity-basis.
Scope 2
In 2025, CPChem’s Scope 2 emissions amounted to 1.95 MMT CO2e on an operated basis, and 2.53 MMT CO2e on an equity basis, on a market-basis.
In 2025, CPChem’s Scope 2 emissions amounted to 1.87 MMT CO2e on an operated basis, and 2.46 MMT CO2e on an equity basis, on a location-basis.**
Scope 3
CPChem is evaluating Scope 3 emissions in alignment with the GHG Protocol and continues to advance efforts to measure greenhouse gas emissions across its value chain. The company’s aspiration is to develop a comprehensive GHG emissions inventory encompassing Scope 1, Scope 2, and Scope 3 emissions for future reporting. CPChem intends to use this inventory to enhance transparency and help identify potential opportunities to reduce GHG emissions.
* The calculation of CPChem’s GHG emissions data is consistent with the World Resources Institute and the World Business Council for Sustainable Development Greenhouse Gas Protocol.
** Location-based reporting uses the average emissions intensity of the local power grid, while market-based reporting reflects emissions from the specific electricity contracts a company has purchased. 2022 eGrid and 2023 Green-E (2021 data) emission factors were used to calculate RY2025 Scope 2 emissions.
Combustion of fuels in ethylene furnaces and steam boilers, and process-related emissions such as flaring represent most of CPChem’s Scope 1 emissions. CPChem’s Scope 2 emissions originate primarily from third-party providers in the generation of energy used by CPChem. Supplied energy includes power procured from the electric grid, steam cogeneration and imported steam. CPChem’s ethylene assets typically achieve a lower GHG emissions intensity compared to similar global facilities due to fleet location, ability to crack light feedstocks and regular improvements in energy efficiencies.
Scope 1 and 2 Operated GHG Emissions Sources
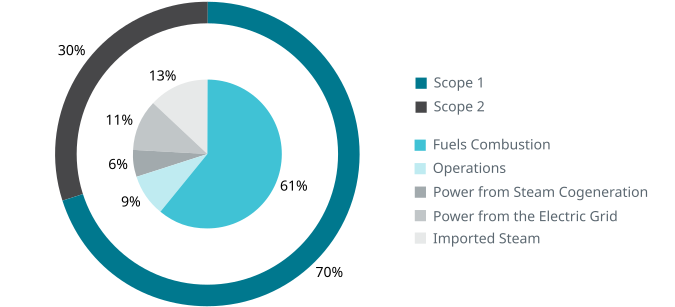
In 2025, CPChem’s absolute GHG emissions decreased both on an operated and equity basis compared to the prior year. CPChem facilities are focusing on managing GHG emissions intensity while mobilizing assets to meet the global demand for its products. We completed site Marginal Abatement Cost Curve (MACC) assessments at all sites in 2025, marking a milestone for a major cross-functional effort across the enterprise.
CPChem is targeting a 15% reduction in its carbon intensity compared to a 2020 baseline. This target includes reductions in both Scope 1 and Scope 2 GHG emissions at CPChem-operated assets. In 2025, CPChem delivered its second-best carbon intensity performance since establishing its baseline in 2020.
During the next several years we plan to continue to grow our production capacity, operationalize new more efficient assets, and implement projects identified through MACC Assessments. We remain dedicated to efficient operations and reducing GHG emission intensity and acknowledge that GHG emissions will change as we undertake these projects that are essential to achieving our goals. Explore our Performance Data to learn more about emissions at CPChem.
GHG Emissions
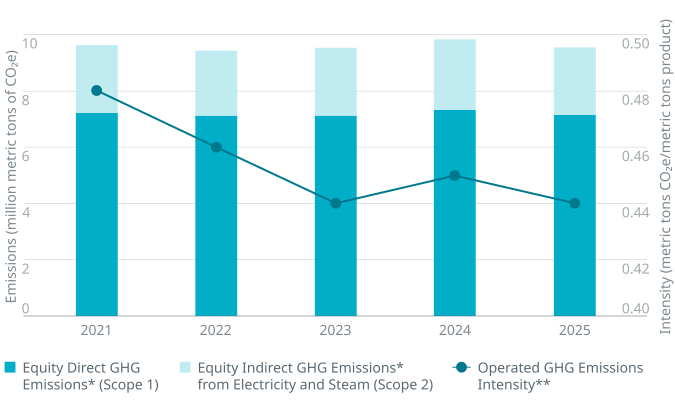
** GHG Intensity is reported on an operated basis and represents 100% stake for wholly owned operations, inclusive of one CPChem operated Owner’s facility at Old Ocean, Texas. GHG Intensity is the ratio of the greenhouse gases emitted (MT of CO2e) divided by the products produced (MT of product).