Energy
We support access to affordable and clean energy, optimize energy consumption and seek to minimize energy intensities.
SDG #7, Affordable and Clean Energy
Our company purchases energy in the form of fuel, electricity and steam. Additionally, our manufacturing facilities utilize by-product fuels generated during operations to produce energy on-site. Longstanding programs at CPChem, focused on reliability and energy management, enable reductions in carbon intensity and improvements in other air emissions performance.
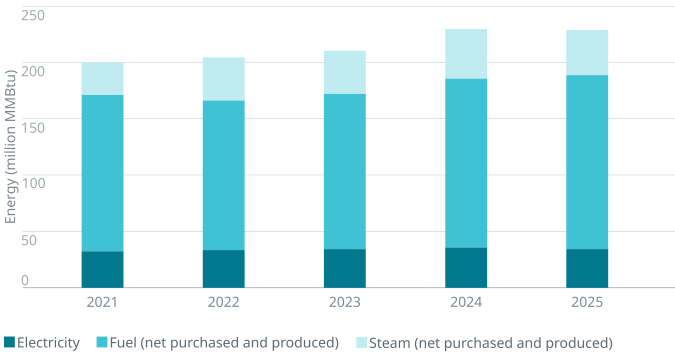
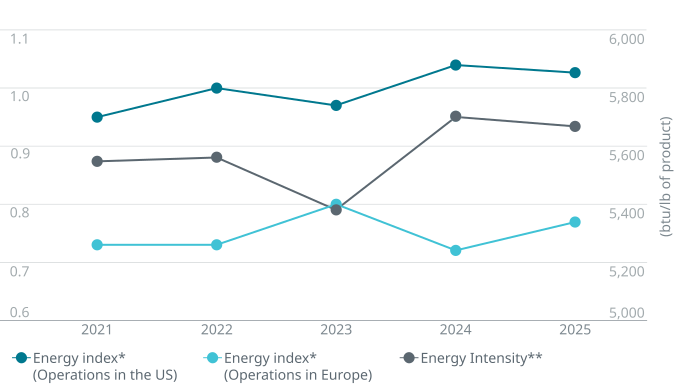
In 2025, CPChem’s equity global energy consumption reached 230 million MMBtu, with an energy intensity of 5675 Btu per pound of product on an operated basis. Total energy consumption increased in 2025 due to higher fuel consumption and production. CPChem’s manufacturing teams continuously strive to enhance efficiency across our facilities and improve energy performance.
Energy Consumption*
Energy Best Practice Teams
CPChem empowers site Energy Best Practice Teams to enhance energy performance and spearhead energy reduction initiatives. Team leaders regularly convene to exchange best practices, celebrate achievements, and challenge one another to creatively meet the company’s energy goals.
Our teams use facility-level energy intensity index to standardize benchmarking and monitoring efforts while tracking annual progress toward energy reduction goals. CPChem’s 2025 energy intensity index in its operated regions was 0.77 (Europe), and 1.03 (United States). See our 2025 Performance Data for more details on energy performance.
Regional Energy Index and Energy Intensity
** Energy intensity is reported on an operated basis and represents 100% stake for wholly owned operations, with the exception of Performance Pipe.